We’re excited to share the latest addition to our Earth Observation products: True Color (RGB) imagery. You can now explore your fields through satellite images that look just like what you’d see with the naked eye from above. By combining the red, green, and blue spectral bands, these visuals offer a natural, intuitive view of crop development throughout the season.
Why True Color Matters in Precision Farming
While vegetation indices like NDVI remain essential for accurate crop diagnostics, True Color imagery adds a powerful layer of context. It allows:
- quickly assess vegetation health and growth,
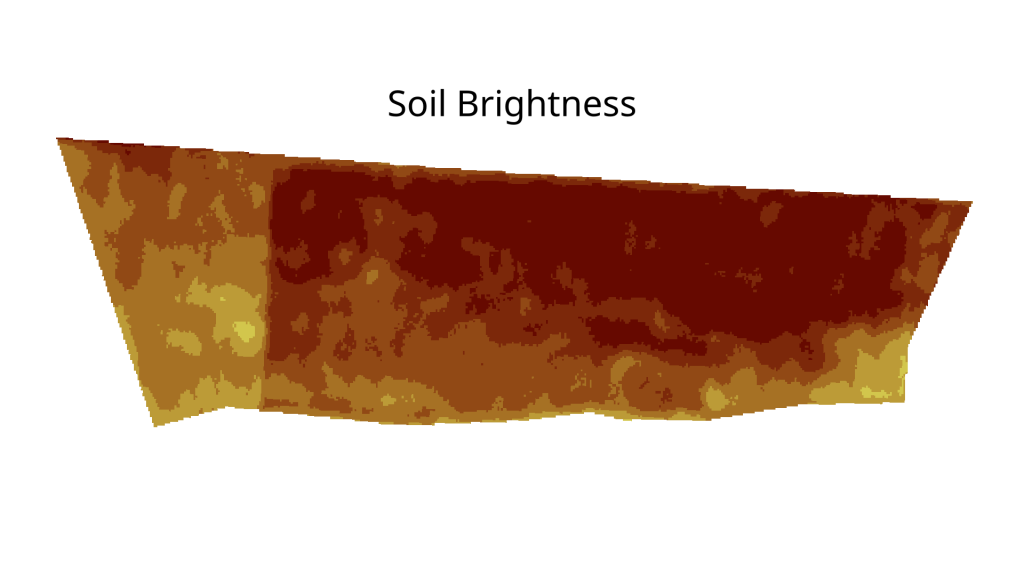
- identify soil exposure, moisture patterns (see the image below), and crop stress
- detect anomalies such as disease patches or unexpected field activity
- visually validate your analytical outputs to ensure results match real-world conditions
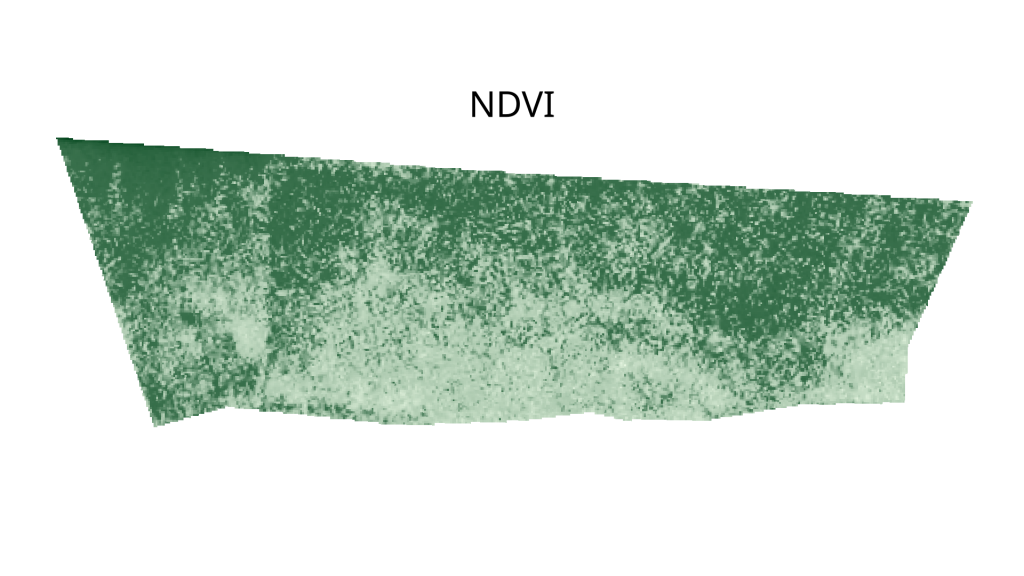
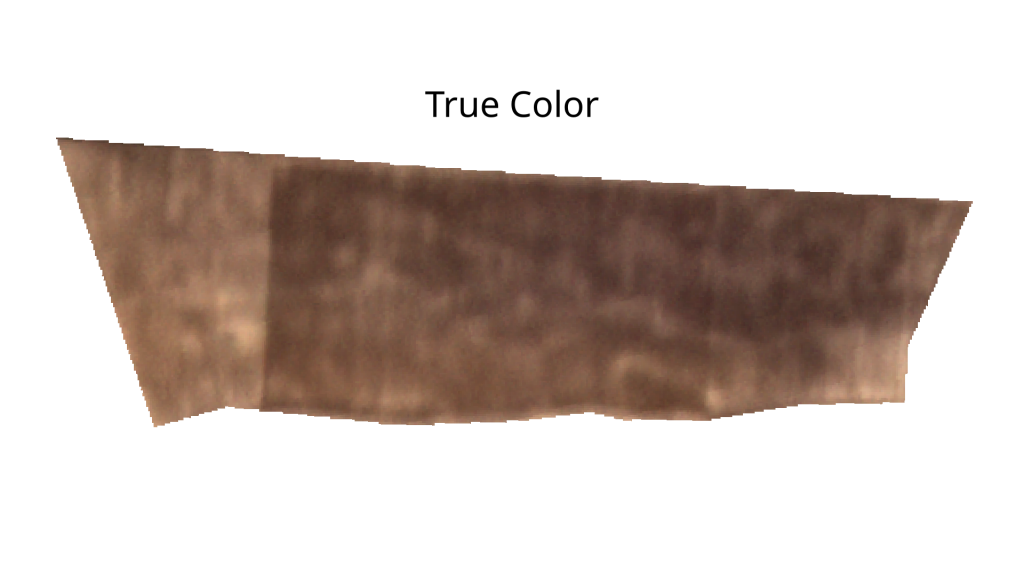
RGB imagery becomes especially useful when combined with analytical layers like NDVI, where human-readable visuals help confirm what the data shows.
See Your Season Come to Life
As part of this launch, we’re showcasing a full-season animation of rapeseed development, featuring both True Color (RGB) and NDVI imagery.
You’ll clearly see the progression:
- Early-season bare soil
- Mid-season dense, vibrant vegetation
- Late-season blooming and pre-harvest changes
These animations highlight how combining RGB and NDVI gives you a richer, more complete understanding of crop performance throughout the season.
Available Across Major Satellite Sources
True Color imagery is now available for all multispectral datasets accessed through the DynaCrop API, including:
- Sentinel-2
- Planet