Time-series is(not) about taking the big step back

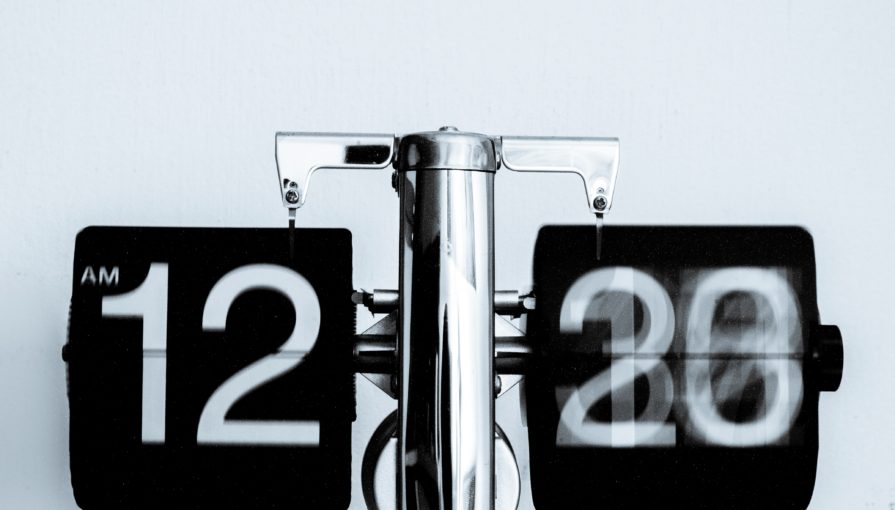
Remember Cher crooning the 1989 hit song ‘If I Could Turn Back Time’?
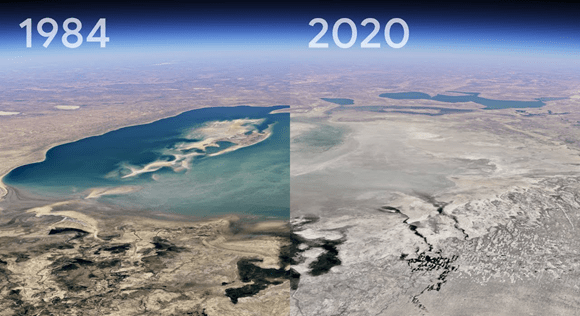
She probably wishes that she had a time machine on her hands – and although the laws of physics and limitations of the present technology may have stopped Cher from travelling back into her past, there is one other way that she could have looked back: time-series satellite data. For example, the popular cloud platform Google Earth has been using time-series satellite data to peek back in time to track the changes of natural bodies. It has even been used to understand how we have left a mark on the planet. Earlier this year, the platform released a new feature that allows users to go as far back as 1984 to see changes in glaciers, forests, lakes and even cities.
But why would this type of time-series imagery be important? And how is it relevant to what we do at DynaCrop?
What is time-series data in satellites?
The simple answer: getting a bigger picture, or as Google Earth director Rebecca Moore puts it, “It’s about taking the big step back.” Time-series data is crucial to get a better understanding of past conditions, which can, in turn, inform future decisions.
Time series data in satellites are captured along two factors: space and time, sometimes also referred to as spatio-temporal imagery. Space refers to an area of focus where the satellite captures data in different spectrums to track changes. Sometimes these changes aren’t clearly visible through standard imaging technologies and may require the satellite to capture imagery in infrared. Time is the other indicator in which imagery is captured over a certain time period to understand the scale of changes.
The quality and usability of this data is also important and is determined by the frequency of revisits that the satellite does in a certain area. If you read our last blog, we talked about how at DynaCrop we use Sentinel 1 and 2 data for our products. Sentinel satellites have a fast revisit time and have a global coverage – which means that we have better quality time-series data.
Precision farming and time-series information
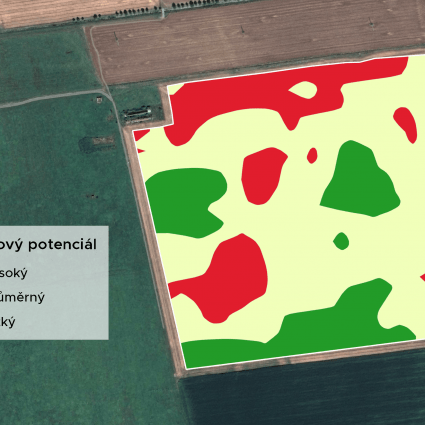
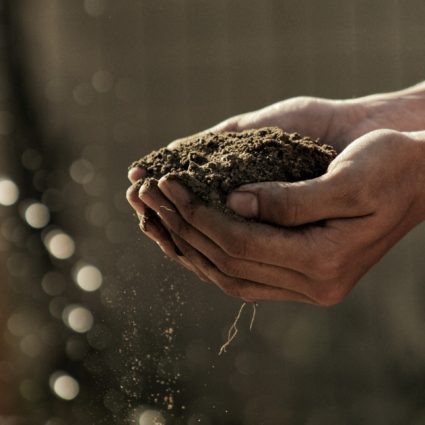
In agriculture, time-series data is important in getting a better assessment of the factors required to farm more efficiently. Satellite-derived data can be used to detail information like historical trends of moisture, fertility and erosion in a given area. Arguably it’s also the first step in thinking about a sustainable approach to your agriculture operations in what’s known as precision farming.
Precision farming helps you prioritize your farm needs with the help of data-driven insights – something that we at DynaCrop can help you with. In addition to the other options you have of assessing soil moisture and determining whether things like seed, water or fertilizer should be variably applied, the other ingredient missing is time! Time-series data helps you assess these inputs over a period of time to understand the type of variations that exist within your field. For example, suppose you want to understand the soil moisture of your field. Assessing the moisture levels will give you a better understanding of the prevailing conditions in your farm at that particular time. However, with time-series data you will be better prepared in understanding the exact time periods in which the soil on your farmland is particularly dry or wet. This would further help you estimate the amount of water required during dry vs. wet seasons.
Get in touch
DynaCrop offers a time-series option for farmers and companies working with farmers, that are interested in tracking historical data. Through this, we provide field-based services that help you find out variations between, and even within seasons. These comparisons can give you a better understanding of the actual investment required in your field with respect to past conditions. Depending on your requirements you can even understand how conditions between two (or more) types of fields have varied.
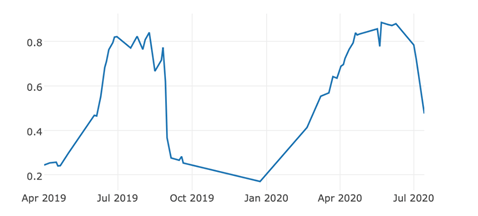
As in the screenshot above, data is represented as a corresponding value against a list of dates. The services are provided for all available products that DynaCrop offers, ranging from measuring soil moisture to identifying nitrogen deficiencies in the soil. You can find out more about these products here. Whatever the requirement, we are sure that you will not find yourself in Cher’s position, yearning to turn back time. The clarity and resolution of satellite data that is available with DynaCrop will surely give you a better understanding of exact conditions in your farmland that have changed over time.
If you want to find out more technical details around our time-series offer, you can access the documentation here. Alternatively, you can directly get in touch and speak to us about what interests you about our technology.