Introducing DynaCrop Daily Plan in 3-meter sharpness
DynaCrop has lately undergone a splendid transition. Its new version is now enriched by a new high-resolution plan: DynaCrop Daily. With that, a single agriculture parcel can be sensed almost every day in 3-meter detail. Not only does a new data stream increase the spatial and temporal resolution of DynaCrop insights but also it opens up new possibilities. Knowledge derived from such data answers a novel set of precision agriculture needs.
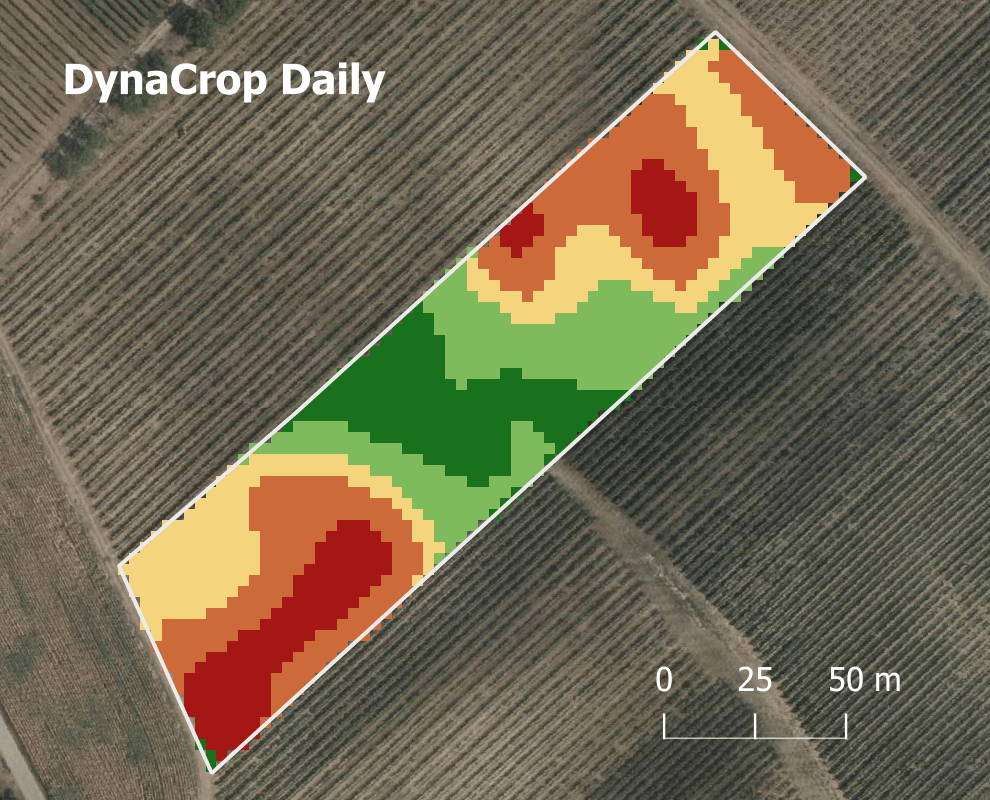
Which problems can be solved by DynaCrop Daily?

I am planning in-season fertilizing, so I want to know the latest growth development in the field. But it is in the tropics and I am getting impatient to get any cloud-free data.
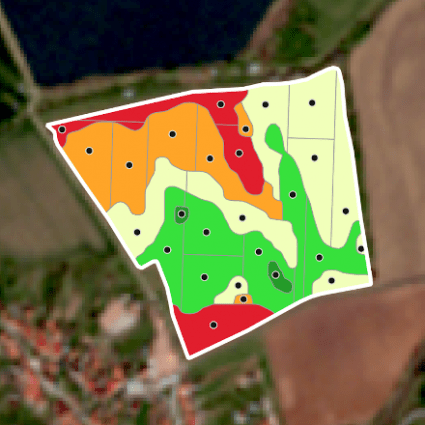
Try Field zonation maps using DynaCrop Daily with over 3 times more frequent data availability. Even in the cloudy tropics that increases the chance to collect desired field insights.


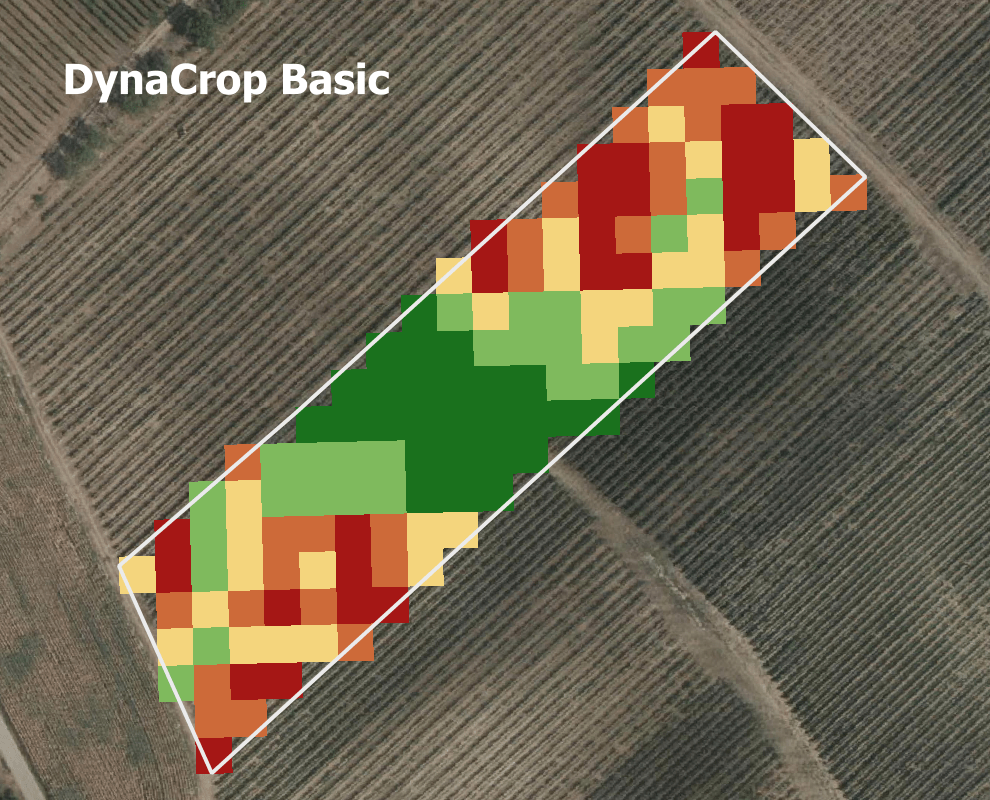
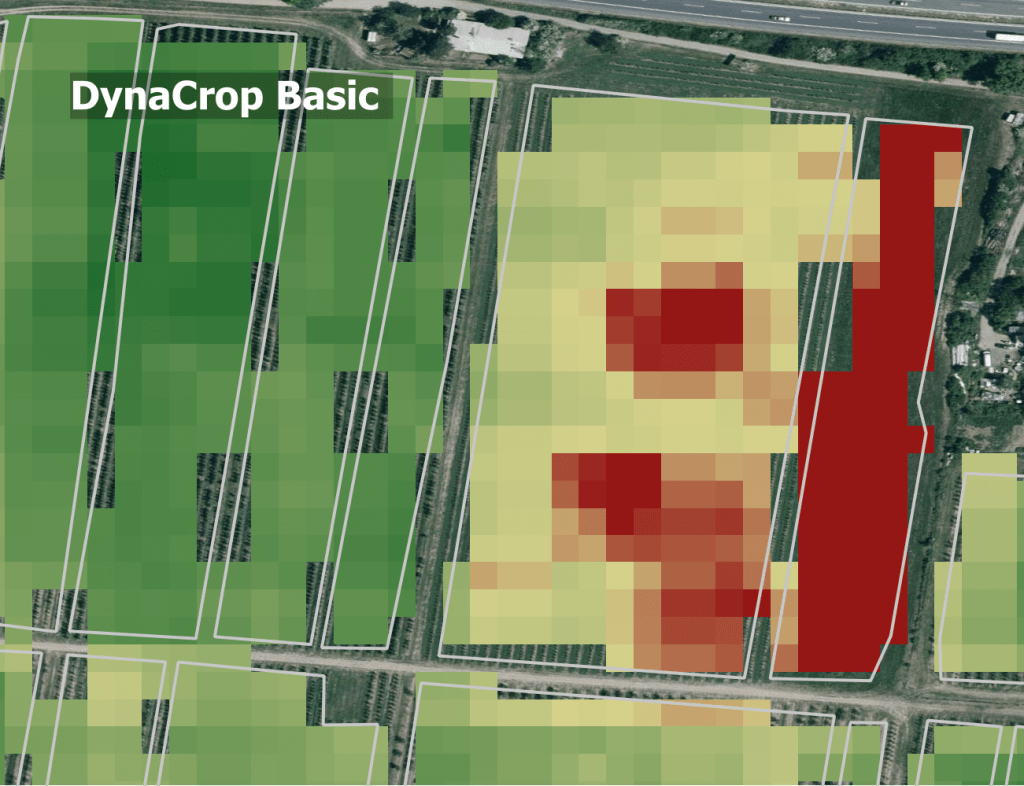
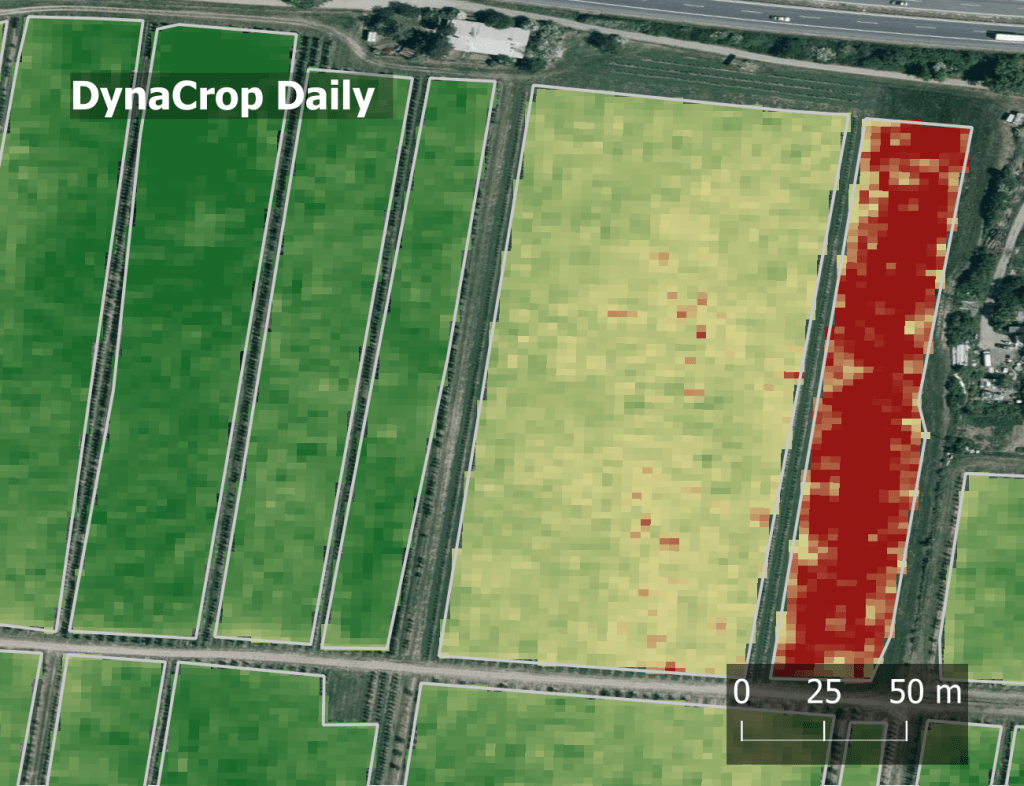
Okay, I want to use satellite data, but my crop parcels have 2 hectares or less. They are too small to get relevant pixels from DynaCrop Basic.
DynaCrop Daily delivers 3-meter pixels which enable satellite monitoring even on smaller fields.


Perfect! I want to detect weed hotspots to plan targeted herbicide applications.
Use the detailed monitoring of DynaCrop Daily to detect such weed islands for more accurate targeted spraying.


Great. Next, I would like to find out the plant nutrient deficiencies and disease symptoms.
DynaCrop Daily offers new spectral indices revealing pigment content including chlorophyll, carotenoid, and anthocyanin or detecting yellow rust (see Table below).


Sweet! Now, I want to monitor my orchards but 10-meter data mixes the signal with grass undergrowth.
If you know the actual extent of the tree canopies, with DynaCrop Daily you can isolate orchard signal from the undergrowth and proceed with clean analysis. If you need a hint about that, let us know, and we can pilot it with you.


Thanks a lot! Can we discuss these use cases in detail?
No problem! We are here to give tailored recommendations. Just book a meeting, where your needs will be addressed. See you there!

DynaCrop Basic vs. DynaCrop Daily
The standard outputs of Dynacrop, such as DynaCrop, such as Crop monitoring data, Field zonation maps, and Time series are now available more frequently, with increased spatial resolution and based on more robust data. This new data stream is named DynaCrop Daily. At the same time, the original DynaCrop products will remain with the plan nickname DynaCrop Basic, meaning there is no need to worry about losing something familiar. Additionally, DynaCrop Daily will inherently encompass all the functionalities of DynaCrop Basic.
Table 1: What the new data stream brings and how it stands compared to standard familiar outputs
| Data stream | DynaCrop Basic | DynaCrop Daily |
| Top frequency of sensing | every 5 days | every day |
| Min size of 1 pixel | 10 meters | 3 meters |
| DynaCrop Monitoring | ✔ | ✔ |
| DynaCrop Field Zonation Maps | ✔ | ✔ |
| DynaCrop Time Series | ✔ | ✔ |
| Basic products (spectral indices) | 6 | 6 |
| Source-unique products (spectral indices) | 12 | 12 +10 |
| Automated cloud filtering | ✔ | ✔ |
| Source satellite mission | Sentinel-2 | Sentinel-2 + PlanetScope |
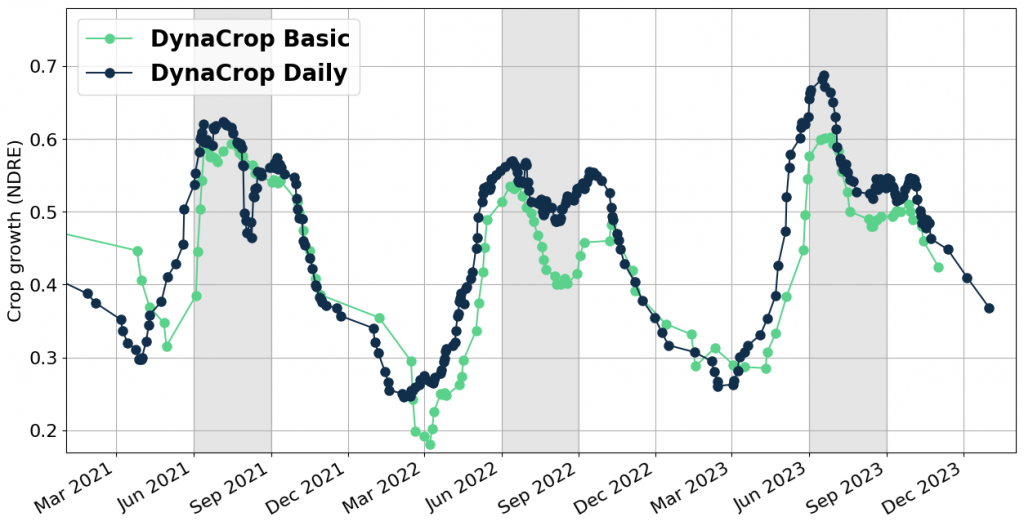
In the chart provided below, we compare the frequency of data captures between DynaCrop Daily and Basic. During an average vegetation season, DynaCrop Daily achieves 78 cloud-free observations, surpassing the 31 by DynaCrop Basic. Notably, DynaCrop Daily’s more frequent observations allow for earlier detection of growth during the crucial green-up phase, facilitating timely precision farming interventions. Additionally, the data from DynaCrop Daily reveals somewhat improved variability detection at the season’s peak.
Exploring new horizons with DynaCrop Daily
DynaCrop Daily is not just about better resolution. It is also about smarter data. There are several new insights possible to be extracted that enable brand-new precision farming use cases. We have conducted deep research on the ones our clients asked for and others we suggest as useful. The table below shows new EO-products (spectral indices) accessible in 3-meter resolution with a daily revisit along with their use case.
Table 2: Standard and new EO-products unique to DynaCrop Daily
| Product ID in API | Product name | Use case |
| NDVI | Normalized Difference Vegetation Index | Golden-standard for vegetation vigour |
| EVI | Enhanced Vegetation Index | Vegetation density |
| MSAVI2 | Modified Soil-adjusted Vegetation Index | Green matter of sparse vegetation |
| PVI* | Perpendicular vegetation index | LAI alternative for vegetation density |
| PRI* | Photochemical Reflectance Index | fAPAR alternative, Photosynthetic activity, Biomass growth modelling |
| MTVI2* | Modified Triangular Vegetation Index | Chlorophyll content insensitive to biomass |
| NDRE | RedEdge Normalized Vegetation Index | Vegetation vigour, Variability of nitrogen for fertilizing needs |
| CL_RE* | RedEdge Chlorophyll Index | Chlorophyll content for vegetation vigour |
| CCI* | Chlorophyll/ Carotenoid Index | Ratio between pigments: Gross primary productivity, Carbon uptake models |
| CAR_RE* | Red-edge Carotenoid Reflectance Index | Carotenoid pigment content |
| SIPI* | Structure Insensitive Pigment Index | Ratio between carotenoids and chlorophyll for high LAI variability parcels |
| ARI1* | Anthocyanin Reflectance Index | Anthocyanin pigment content for physiology and stress detection |
| YRSI* | Yellow Rust Spore Index | Detection of yellow rust on winter wheat |
| NDWI | Normalized Difference Water Index | Surface water detection (waterlogging) |
| SOC_VIS | Soil Organic Carbon | Carbon storage in surface soil |
| SI* | Salinity Index | Proxy to soil salinisation |
If you want to find out more about rather technical news and integration optimization coming with the new DynaCrop version – visit the relevant section in the documentation.
Where does this new data stream come from?
PlanetScope, the largest Earth Observation (EO) constellation in orbit, revolutionizes how we perceive agricultural monitoring. Despite the modest size of 30 cm of each cubesat, the flock of 240 satellites brings a powerful punch in Earth monitoring. We have picked only PlanetScope’s latest generation (SuperDove) because for farming use cases it offers parameters comparable to Sentinel-2 data, the default input of DynaCrop. At the same time, it is supported by ever more confident cloud detection algorithms. The integration of PlanetScope data into DynaCrop Daily allows for unprecedented detail and frequency. One of our tests showed that with DynaCrop Daily the number of clear observations of a single location in the summer season increases more than three times over (from regular 32 to 98). Beyond precise up-to-date insights, it enables long-term analyses such as Field Zonations to empower decision-making with historical data dating back to 2020.
Up-to-date as well as multi-season analysis
DynaCrop Daily data does not only serve for up-to-date analysis. It is a gateway to understanding the past, and present with the potential to indicate future crop development. Bringing the historical perspective, our data allows for in-depth comparisons between different seasons at the same location.
To ensure the utmost reliability and accuracy upon integration, we have tested the DynaCrop Daily data across various dimensions. A critical aspect of this testing was to determine the time points of complete data coverage across different global regions. Our clients need to recognize that data availability in archive dates varies depending on the geographical location. Also, the date of first available data is not the only relevant indicator. The reason is that Planet did not launch all its satellites at once, but rather in several iterations. Therefore the sensing frequency increased rather gradually until it reached today’s daily revisit. The table below explains this well enough. It is an essential consideration when requesting DynaCrop Daily outputs.
Table 3: Examples of the global availability of DynaCrop Daily long-term analysis
| Temporal coverage | Europe | South America | Asia | Africa |
| When first data | Madrid: 05/2020 Prague: 04/2020 Rome: 03/2020 Belgrade: 03/2020 | Rio de Janeiro: 4/2020 | Bangkok: 03/2020 | Lagos: 01/2020 |
| When 10+ days with data per month | Madrid: 11/2020 Prague: 11/2020 Rome: 10/2020 Belgrade: 11/2020 | Rio de Janeiro: 01/2021 | Bangkok: 11/2020 | Lagos: 11/2020 |
| When 20+ days with data per month | Madrid: 05/2021 Prague: 06/2021 Rome: 08/2021 Belgrade: 06/2021 | Rio de Janeiro: 08/2021 | Bangkok: 11/2021 | Lagos: 11/2021 |
What else can you expect in the first half of 2024?
DynaCrop Daily is more than an upgrade – it is a new dimension of precision agriculture. Enhanced resolution, frequent updates, and unique EO products are just the beginning. We are building unprecedented added-value products which elevate PlanetScope data even further by generating customized reports and optimizing the outputs for end-user utilization. Read further to have a little taste of what is released in the months to come.
Daily Field Report – automated system generating reports showing key information about crop and soil on a daily basis in a farmer-friendly way including anomaly detection, scouting recommendations and other analytical figures for decision-making.
Yield Potential – maps of long-term productivity zones based on recurring crop growth patterns useful for variable rate seeding, nitrogen application and soil sampling optimization.
Are you ready to start using the new data stream directly in the DynaCrop ecosystem? The transition is seamless and easy. Contact us for a swift upgrade from default DynaCrop Basic to DynaCrop Daily.
Free testing of DynaCrop Daily is also an option. Contact us and we will make it happen.

Precision Agriculture | High-Resolution Satellite Data | Agronomy Innovation | PlanetScope Satellite | Advanced Crop Monitoring | Satellite Data Analytics | DynaCrop Daily Plan | Agricultural Technology | Farming Data Analysis | Crop Health Insights | Earth Observation Technology | Satellite Imagery in Agriculture | Precision Farming Solutions | Field Zonation Techniques | Crop Growth Monitoring | 3-Meter Satellite Resolution | Daily Farm Data Updates | Agritech Advancements | Smart Agriculture Tools | Satellite Data for Farming | Crop Analysis Technology | Agricultural Data Stream | Farm Management Software | Sustainable Farming Practices | Enhanced Crop Observations | Real-Time Agricultural Data | Farming Efficiency Improvements | Precision Crop Care | Data-Driven Agronomy | Seasonal Crop Analysis


